


Research - Projects
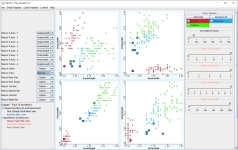
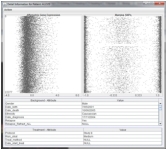
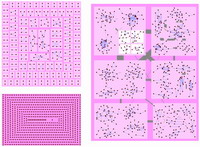
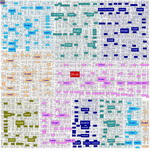
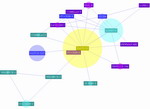
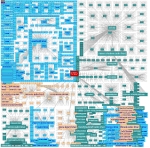
![]() Visual Analytics Tool for tabular data. The project develops a robust and customisable visual analysis tool for visualising tabular (multi-dimensional) data. We use multi-attributed scatter plots to provide different views when mapping different attributes to properties. Details and downloadable program and source code are available at the TabuVis Project page.
Visual Analytics Tool for tabular data. The project develops a robust and customisable visual analysis tool for visualising tabular (multi-dimensional) data. We use multi-attributed scatter plots to provide different views when mapping different attributes to properties. Details and downloadable program and source code are available at the TabuVis Project page.
 |
 |
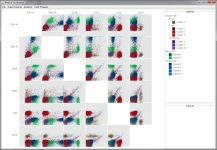 |
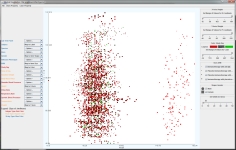
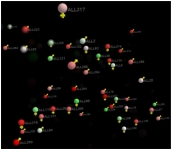
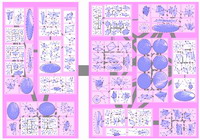
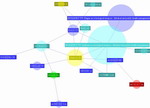
![]() Visual Analytics for biomedical and genomic data (in collaboration with Children Hospital's at Westmead and UTS). The project develops new technologies for the extraction of knowledge from both complex biomedical and genomic data and then visualise them in a meaningful and interpretable way. The development includes enabling algorithms and technologies through an approach that will synergise the powerful visual analytics, including automated data analysis and visualisations, and the expertises of domain experts in the medical field. The results of this project will be applied on the diagnosis and treatment of children with Cancer, e.g. Acute Lymphoblastic Leukaemia (ALL)
Visual Analytics for biomedical and genomic data (in collaboration with Children Hospital's at Westmead and UTS). The project develops new technologies for the extraction of knowledge from both complex biomedical and genomic data and then visualise them in a meaningful and interpretable way. The development includes enabling algorithms and technologies through an approach that will synergise the powerful visual analytics, including automated data analysis and visualisations, and the expertises of domain experts in the medical field. The results of this project will be applied on the diagnosis and treatment of children with Cancer, e.g. Acute Lymphoblastic Leukaemia (ALL)
 |
 |
 |
 |
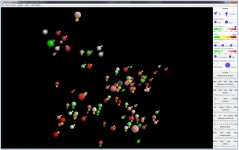
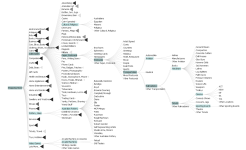
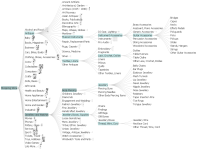
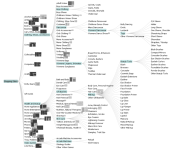
![]() Tree Visualisation with Visual Cues. This project extends a previous work on node link tree visualisation and interaction by providing visual clues on hidden structures. We adopt DOITree from Prefuse package (https://github.com/prefuse/Prefuse), a multi-focal tree layout algorithm, for exploring large hierarchical structures.
Details and downloadable program and source code are available at the TreeVis Project page.
Tree Visualisation with Visual Cues. This project extends a previous work on node link tree visualisation and interaction by providing visual clues on hidden structures. We adopt DOITree from Prefuse package (https://github.com/prefuse/Prefuse), a multi-focal tree layout algorithm, for exploring large hierarchical structures.
Details and downloadable program and source code are available at the TreeVis Project page.
 |
 |
 |
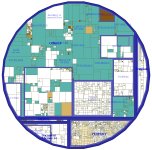
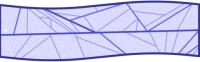
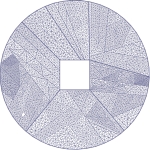
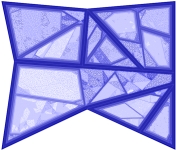
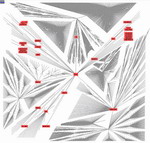
![]() Space and Shape Constraint Visualization (in collaboration with UTS). The project develops new new techniques and algorithms for quickly partitioning and visualizing very large hierarchical structures within a variety of arbitrary shapes and space.
Space and Shape Constraint Visualization (in collaboration with UTS). The project develops new new techniques and algorithms for quickly partitioning and visualizing very large hierarchical structures within a variety of arbitrary shapes and space.
 |
 |
 |
 |
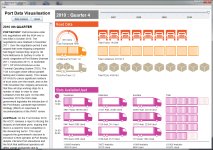
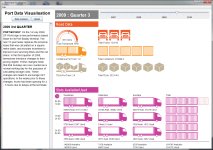
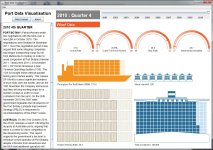
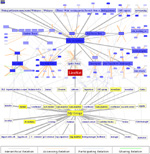
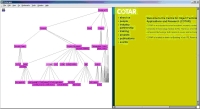
![]() Visual Analytics Logistics Data (in collaboration with Cultural Research Centre). This project is a "proof-of-concept" prototype that used diagrammatic visualization for presenting multi-dimensional port data, in relation to local and global events. Details and downloadable program are available at the Port Data Visualisation Project page.
Visual Analytics Logistics Data (in collaboration with Cultural Research Centre). This project is a "proof-of-concept" prototype that used diagrammatic visualization for presenting multi-dimensional port data, in relation to local and global events. Details and downloadable program are available at the Port Data Visualisation Project page.
 |
 |
 |
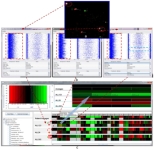
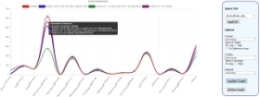
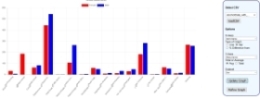
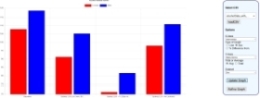
![]() Interactive Charts for Simulation Data (in collaboration with SAX institute). This project develops web-based interactive visualisation to support the analysis and monitoring the data from the comprehensive system dynamics and agent based simulation. This work visualise the data via classical charts and graphs in an interactive way. The web-based platform enables upload csv files, mapping and display the attributes based on users preference..
Interactive Charts for Simulation Data (in collaboration with SAX institute). This project develops web-based interactive visualisation to support the analysis and monitoring the data from the comprehensive system dynamics and agent based simulation. This work visualise the data via classical charts and graphs in an interactive way. The web-based platform enables upload csv files, mapping and display the attributes based on users preference..
 |
 |
 |
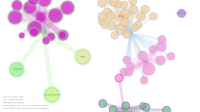
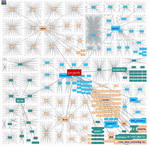
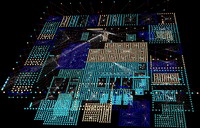
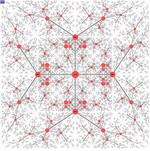
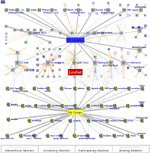
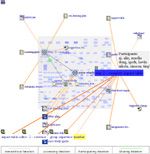
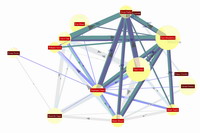
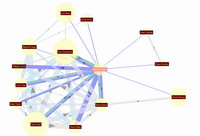
![]() Enabling Intelligent Visual Analytics for large Heterogeneous Networks. The project develops methods and platform for intelligent visual analytics of complex networks. The visualization can intelligently adapt to the analysis task and analyst style in order to provide optimal visual projections in the context of the analysis.
Enabling Intelligent Visual Analytics for large Heterogeneous Networks. The project develops methods and platform for intelligent visual analytics of complex networks. The visualization can intelligently adapt to the analysis task and analyst style in order to provide optimal visual projections in the context of the analysis.
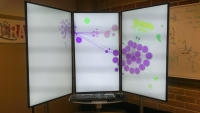
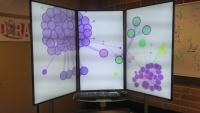
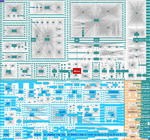
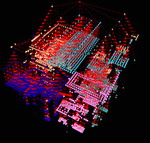
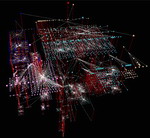
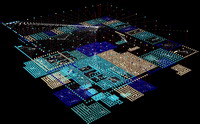
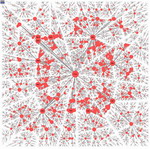
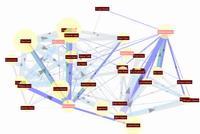
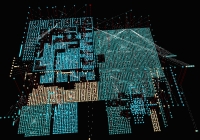
![]() Interactive Visualization of Live Internet Activities in immersive environment.This project develops a real-time and interactive visualization for delivering analysing internet trafficâs behaviours and activities
Interactive Visualization of Live Internet Activities in immersive environment.This project develops a real-time and interactive visualization for delivering analysing internet trafficâs behaviours and activities
 |
 |
 |
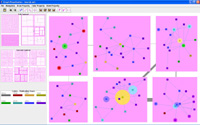
![]() Interactive Visualization of medical activity data (part of WALK 2.0).
Interactive Visualization of medical activity data (part of WALK 2.0).
![]() GVis - This project researches effective interactive visualization techniques for large graphs. The prototype software includes two modules: Clustering and Interactive Visualisation.
GVis - This project researches effective interactive visualization techniques for large graphs. The prototype software includes two modules: Clustering and Interactive Visualisation.
 |
 |
 |
![]() ContextVis - This project researches interactive visualisation of large graphs/networks using chain-context views.
ContextVis - This project researches interactive visualisation of large graphs/networks using chain-context views.
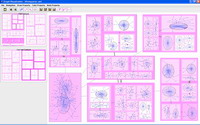
![]() Hierarchical Visualization using Enclosure+Connection (EncCon) -
This is an Enclosure+Connection technique for layout and navigation of Hierarchical Information. The layout uses rectangular enclosure partitioning to ensure the space efficiency, and the navigation is a focus+context navigation technique using semi-transparency approach.
Hierarchical Visualization using Enclosure+Connection (EncCon) -
This is an Enclosure+Connection technique for layout and navigation of Hierarchical Information. The layout uses rectangular enclosure partitioning to ensure the space efficiency, and the navigation is a focus+context navigation technique using semi-transparency approach.
 |
 |
 |
![]() 3D EncCon -
A three-dimensional visualisation of large trees. The three-dimensional visualization includes layout
and navigation. The layout algorithm directly generalizes the two-dimensional EncCon tree layout algorithm to
three-dimensional space in which nodes at the same level of the hierarchy are placed onto the same plane.
3D EncCon -
A three-dimensional visualisation of large trees. The three-dimensional visualization includes layout
and navigation. The layout algorithm directly generalizes the two-dimensional EncCon tree layout algorithm to
three-dimensional space in which nodes at the same level of the hierarchy are placed onto the same plane.
 |
 |
 |
 |
![]() Space-Optimized Tree -
This is an Enclosure+Connection technique for layout and navigation of Hierarchical Information. The layout uses "angular" enclosure partitioning approach where the child nodes are located around their parent.
Space-Optimized Tree -
This is an Enclosure+Connection technique for layout and navigation of Hierarchical Information. The layout uses "angular" enclosure partitioning approach where the child nodes are located around their parent.
 |
 |
 |
 |
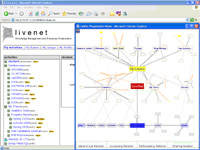
![]() Visualization in Shared Workspace, LiveNet -
A visual interface for collaborative workspaces to enhance the perception, comprehension and manipulation of collaborative elements and relationships as well as their attributes.
Visualization in Shared Workspace, LiveNet -
A visual interface for collaborative workspaces to enhance the perception, comprehension and manipulation of collaborative elements and relationships as well as their attributes.
 |
 |
 |
 |
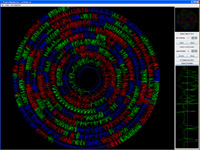
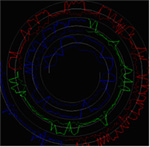
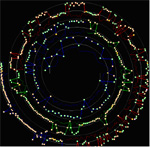
![]() Visualization of Dihedral Signal for Large Protein Sequences -
A clustering and visualization technique for analyzing dihedral angles of large protein sequences.
Visualization of Dihedral Signal for Large Protein Sequences -
A clustering and visualization technique for analyzing dihedral angles of large protein sequences.
 |
 |
 |
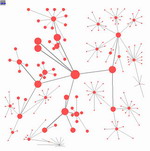
![]() iVisNet -
An interactive visualization for large email networks.
iVisNet -
An interactive visualization for large email networks.
 |
 |
 |
![]() CiteNet -
A Visualization of large citation networks with space-efficient multi-layer optimization.
CiteNet -
A Visualization of large citation networks with space-efficient multi-layer optimization.
 |
 |
 |
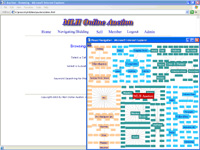
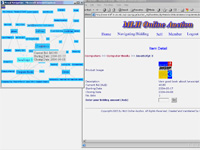
![]() eVisBrowse -
An interactive visual browser for online product catalogues.
eVisBrowse -
An interactive visual browser for online product catalogues.
 |
 |
![]() Web Site Mapping Visualisation -
A system for the extracting and interactive visualisation web site mapping of real websites.
Web Site Mapping Visualisation -
A system for the extracting and interactive visualisation web site mapping of real websites.
 |
 |
 |
